 BoreTherm
Annual minimum / maximum
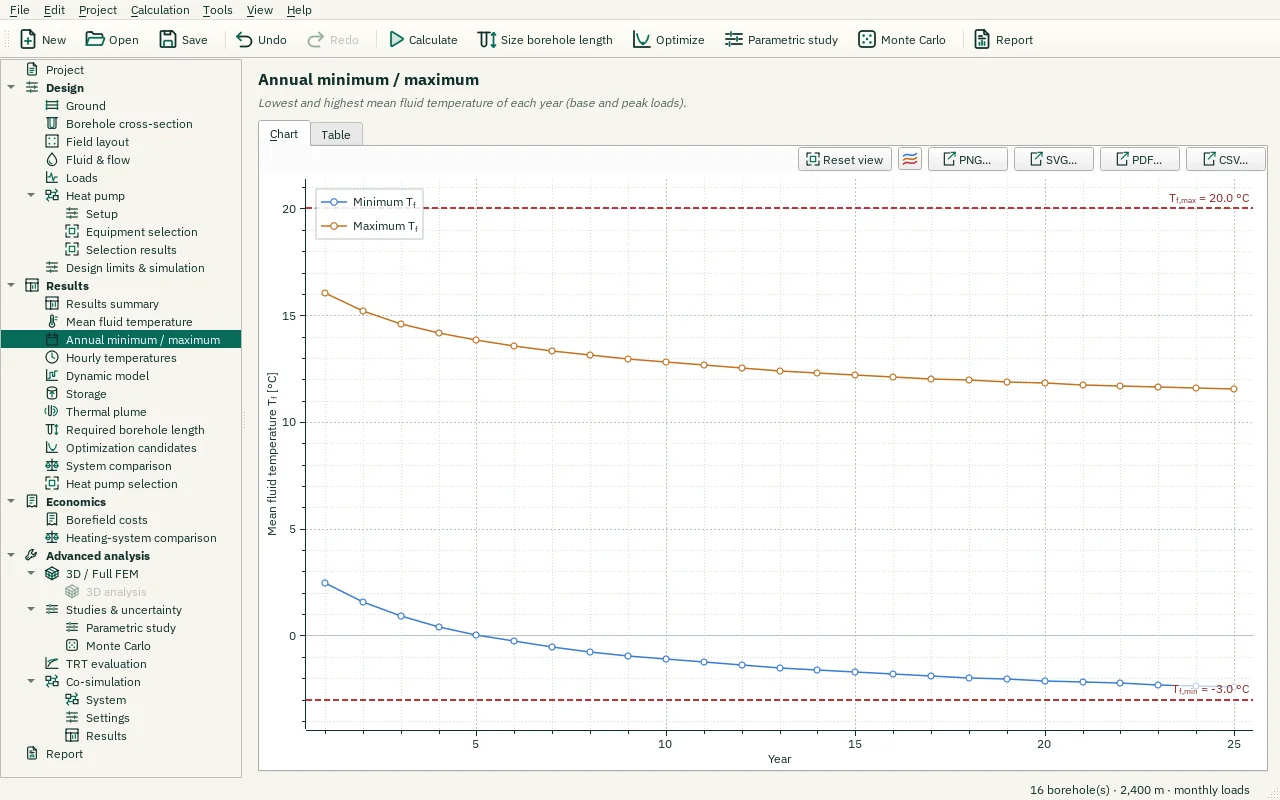
Inspect the worst temperature in each year. Accumulating imbalance may make the last year limiting, while unusual schedules can make an earlier year limiting. Evaluate the whole horizon unless you intentionally select last-year-only sizing.
Step-by-step workflows · Menus and keyboard
| Control | Meaning / action | Unit | Range / choices | Example value |
|---|---|---|---|---|
| Export CSV… | Write the displayed numerical table to a CSV file using the selected CSV format. | |||
| Reset view | Show all data (also: double-click the plot). | |||
| Chart style button | Chart style: title, axis titles, legend, colours, line widths and markers, fonts, grid and background (also in the chart's context menu). | |||
| PNG… | Export the plot as a PNG image. | |||
| SVG… | Export the plot as a vector SVG image (for Word, Inkscape, …). | |||
| PDF… | Export the plot as a vector PDF. | |||
| CSV… | Export the plotted data as CSV. |