 BoreTherm
Chart style
Adjust chart titles, axis labels, legend, series colours/line widths/markers, fonts, grid and background. This chart changes only the current view. This type saves the style for charts of the same type, including reports. All charts changes shared appearance. Reset to default removes overrides at the chosen level after Apply or OK. Cancel leaves unapplied edits out.
Step-by-step workflows · Menus and keyboard
| Control | Meaning / action | Unit | Range / choices | Example value |
|---|---|---|---|---|
| Title: | Font family. Default: the program's font. | Default / Arial / Calibri / Cambria / Candara / Consolas / DejaVu Sans / DejaVu Serif / Georgia / IBM Plex Sans / Liberation Sans / Liberation Serif / Segoe UI / Tahoma / Times New Roman / Verdana | ||
| Font size in points. Default: the chart's size, which follows View → Text size. | Font size in points. Default: the chart's size, which follows View → Text size. | pt | 0 to 48 | 0 |
| Axis titles: | Font family. Default: the program's font. | Default / Arial / Calibri / Cambria / Candara / Consolas / DejaVu Sans / DejaVu Serif / Georgia / IBM Plex Sans / Liberation Sans / Liberation Serif / Segoe UI / Tahoma / Times New Roman / Verdana | ||
| Tick labels: | Font family. Default: the program's font. | Default / Arial / Calibri / Cambria / Candara / Consolas / DejaVu Sans / DejaVu Serif / Georgia / IBM Plex Sans / Liberation Sans / Liberation Serif / Segoe UI / Tahoma / Times New Roman / Verdana | ||
| Legend and labels: | Font family. Default: the program's font. | Default / Arial / Calibri / Cambria / Candara / Consolas / DejaVu Sans / DejaVu Serif / Georgia / IBM Plex Sans / Liberation Sans / Liberation Serif / Segoe UI / Tahoma / Times New Roman / Verdana | ||
| Show the grid lines | Enables or disables this option. | |||
| Background: | Background of the chart; click to choose. | |||
| White | White background (the default, best for printing). | |||
| Text in the legend (rich text allowed). | Text in the legend (rich text allowed). | |||
| Colour of the curve; click to choose. | Colour of the curve; click to choose. | |||
| Line width in pixels (96 per inch). | Line width in pixels (96 per inch). | px | 0.5 to 10 | 1.8 |
| Lines are labelled by the chart; their label is not edited here. | Lines are labelled by the chart; their label is not edited here. | |||
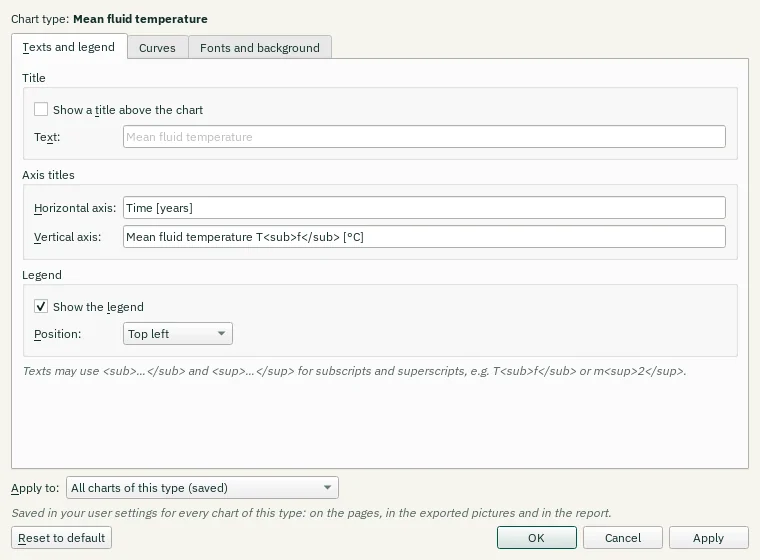
| Show a title above the chart | Enables or disables this option. | |||
| Text: | Title text (rich text allowed, e.g. Tf). | |||
| Horizontal axis: | Axis title with the unit (rich text allowed). Empty: no title. | |||
| Vertical axis: | Axis title with the unit (rich text allowed). Empty: no title. | |||
| Show the legend | Enables or disables this option. | |||
| Position: | Select one of the listed alternatives. | Top left / Top right / Bottom left / Bottom right / Right, centred / Above the plot | ||
| Apply to: | Where the style is applied. Saved styles are kept in your user settings and are used on the pages, in the exported pictures and in the report. | This chart only (until BoreTherm is closed) / All charts of this type (saved) / All charts: fonts, grid and background (saved) | ||
| OK | Accept changes and close. | |||
| Cancel | Close without accepting unapplied edits. | |||
| Apply | Apply changes and keep the dialog open. | |||
| Reset to default | Sets every field to the chart's default (for the chosen "Apply to"); Apply or OK then removes the style at that level. |