 BoreTherm
System comparison results
The headline table: investment, grant, annual full cost (VDI 2067 annuity), levelised cost of heat (heat only and heat + cold), cost of cold, simulated seasonal performance factor (SPF) and the annual performance factor after VDI 4650 Blatt 1:2024 (its factors and notes in the tooltip), modelled peak electrical demand, CO2 (statutory and estimated) and primary energy; the lowest-cost marker skips knocked-out variants. Charts: annuity by cost group with the grant and residual value as separate credits, cumulative discounted cost with low / high carbon-price bands (scenarios, not confidence intervals), CO2 and primary energy. Tables: energy balance, criteria and knock-outs, technology assumptions and the data provenance. Results are indicative and depend on the data set date shown.
Step-by-step workflows · Menus and keyboard
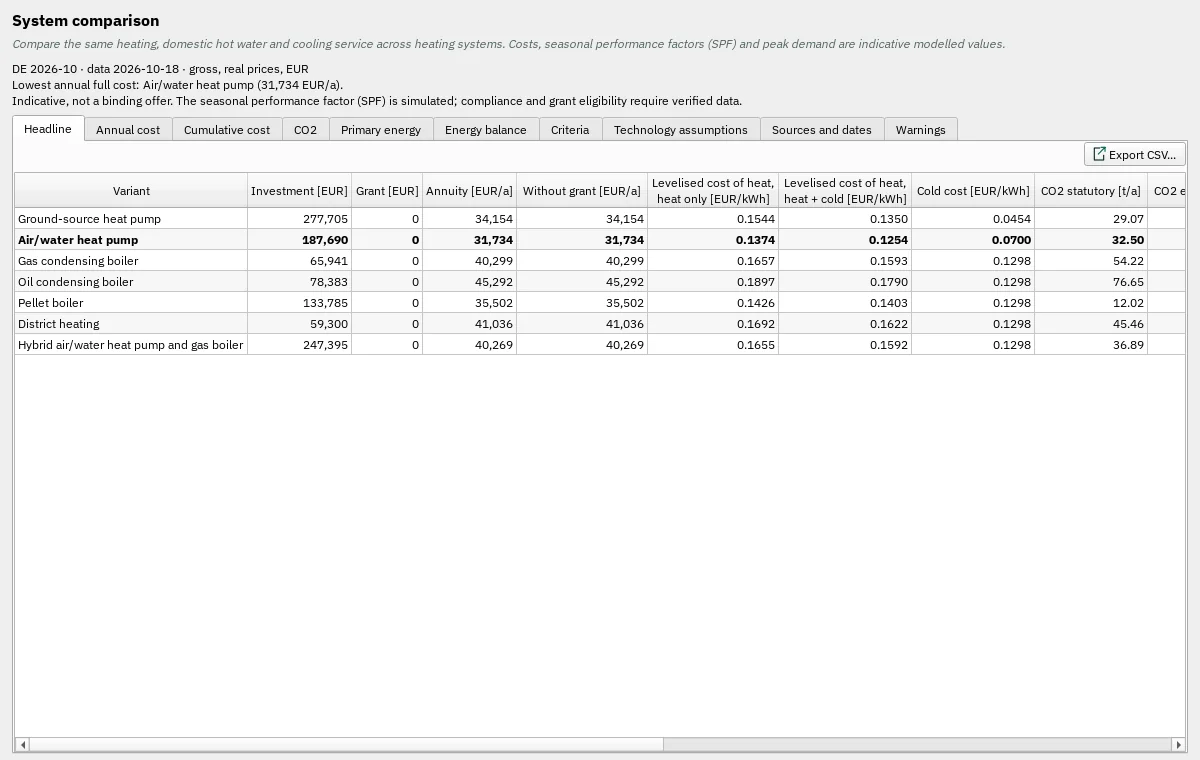
| Control | Meaning / action | Unit | Range / choices | Example value |
|---|---|---|---|---|
| Export CSV… | Write the displayed numerical table to a CSV file using the selected CSV format. | |||
| Reset view | Show all data (also: double-click the plot). | |||
| Chart style button | Chart style: title, axis titles, legend, colours, line widths and markers, fonts, grid and background (also in the chart's context menu). | |||
| PNG… | Export the plot as a PNG image. | |||
| SVG… | Export the plot as a vector SVG image (for Word, Inkscape, …). | |||
| PDF… | Export the plot as a vector PDF. | |||
| CSV… | Export the plotted data as CSV. |