 BoreTherm
Co-simulation results
Inspect recorded outputs, power, coefficient of performance (COP) and borefield temperatures. Compare with the classic calculation with a fixed seasonal performance factor (SPF) while accounting for different assumptions. Results from this feature are preview results.
Step-by-step workflows · Menus and keyboard
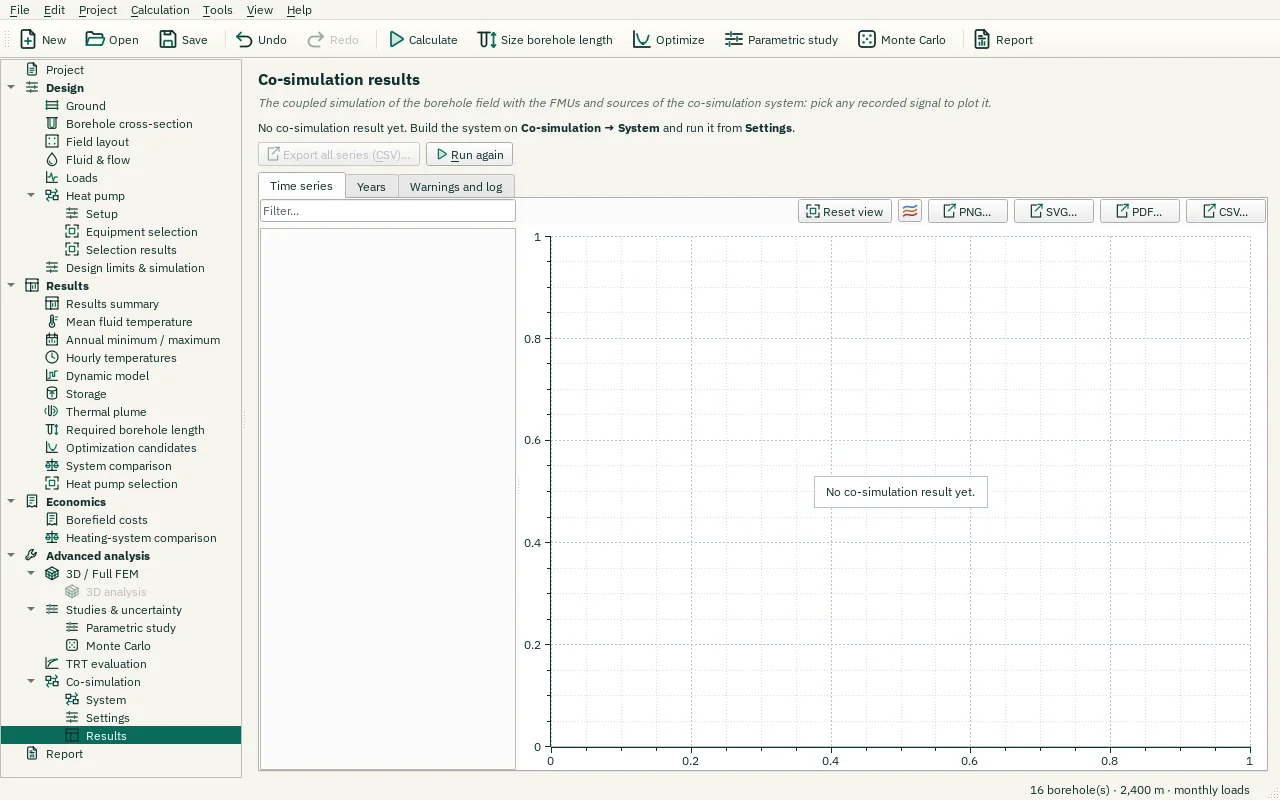
| Control | Meaning / action | Unit | Range / choices | Example value |
|---|---|---|---|---|
| Apply length to project | Set the borehole length of all boreholes to the length found with the co-simulation. | |||
| Export all series (CSV)… | Save every recorded time series as one CSV file. | |||
| Run again | Run the configured co-simulation again with the current project inputs. | |||
| Export CSV… | Write the displayed numerical table to a CSV file using the selected CSV format. | |||
| Reset view | Show all data (also: double-click the plot). | |||
| Chart style button | Chart style: title, axis titles, legend, colours, line widths and markers, fonts, grid and background (also in the chart's context menu). | |||
| PNG… | Export the plot as a PNG image. | |||
| SVG… | Export the plot as a vector SVG image (for Word, Inkscape, …). | |||
| PDF… | Export the plot as a vector PDF. | |||
| CSV… | Export the plotted data as CSV. |