 BoreTherm
Dynamic model
View selected transient windows, inlet/outlet temperature, axial profiles and flow direction. Profiles currently show segment values as steps. Zero flow, reversal and warm-up follow the selected operation controls. Freeze warnings do not imply a freeze/thaw physical model.
Step-by-step workflows · Menus and keyboard
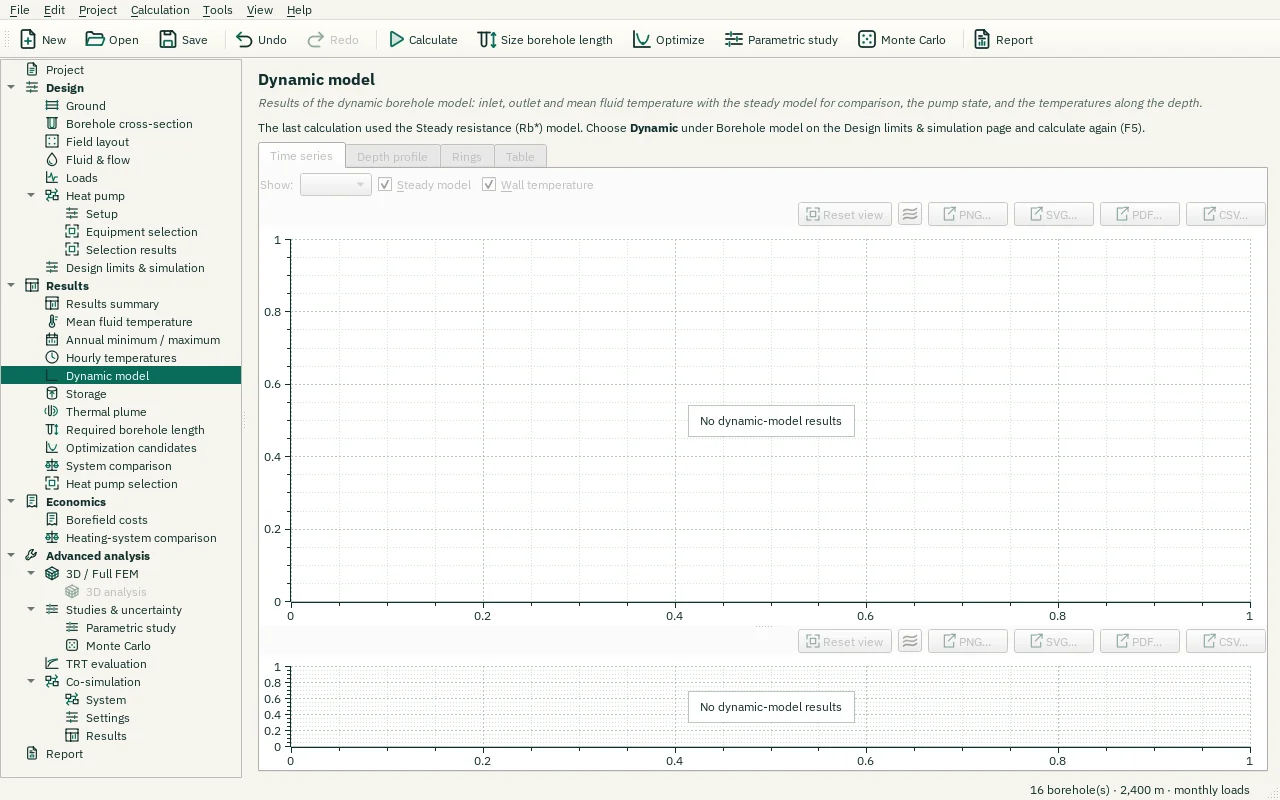
| Control | Meaning / action | Unit | Range / choices | Example value |
|---|---|---|---|---|
| Reset view | Show all data (also: double-click the plot). | |||
| Chart style button | Chart style: title, axis titles, legend, colours, line widths and markers, fonts, grid and background (also in the chart's context menu). | |||
| PNG… | Export the plot as a PNG image. | |||
| SVG… | Export the plot as a vector SVG image (for Word, Inkscape, …). | |||
| PDF… | Export the plot as a vector PDF. | |||
| CSV… | Export the plotted data as CSV. | |||
| Export CSV… | Write the displayed numerical table to a CSV file using the selected CSV format. | |||
| Export CSV… | Write the displayed numerical table to a CSV file using the selected CSV format. | |||
| Dynamic range | The whole period at the output interval, or one of the full-resolution periods (one value per time step; set on the Design limits simulation page). | |||
| Steady model | Mean fluid temperature of the steady borehole model for the same project (hour means). | |||
| Wall temperature | Enables or disables this option. | |||
| Dynamic range | The whole period at the output interval, or one of the full-resolution periods (one value per time step; set on the Design limits simulation page). | Whole period (every 1 h) / Full resolution: day 1.0 – 2.0 | ||
| Dynamic range | The whole period at the output interval, or one of the full-resolution periods (one value per time step; set on the Design limits simulation page). | Whole period (every 1 h) / Full resolution: day 940.0 – 954.0 |