 BoreTherm
Fluid & flow
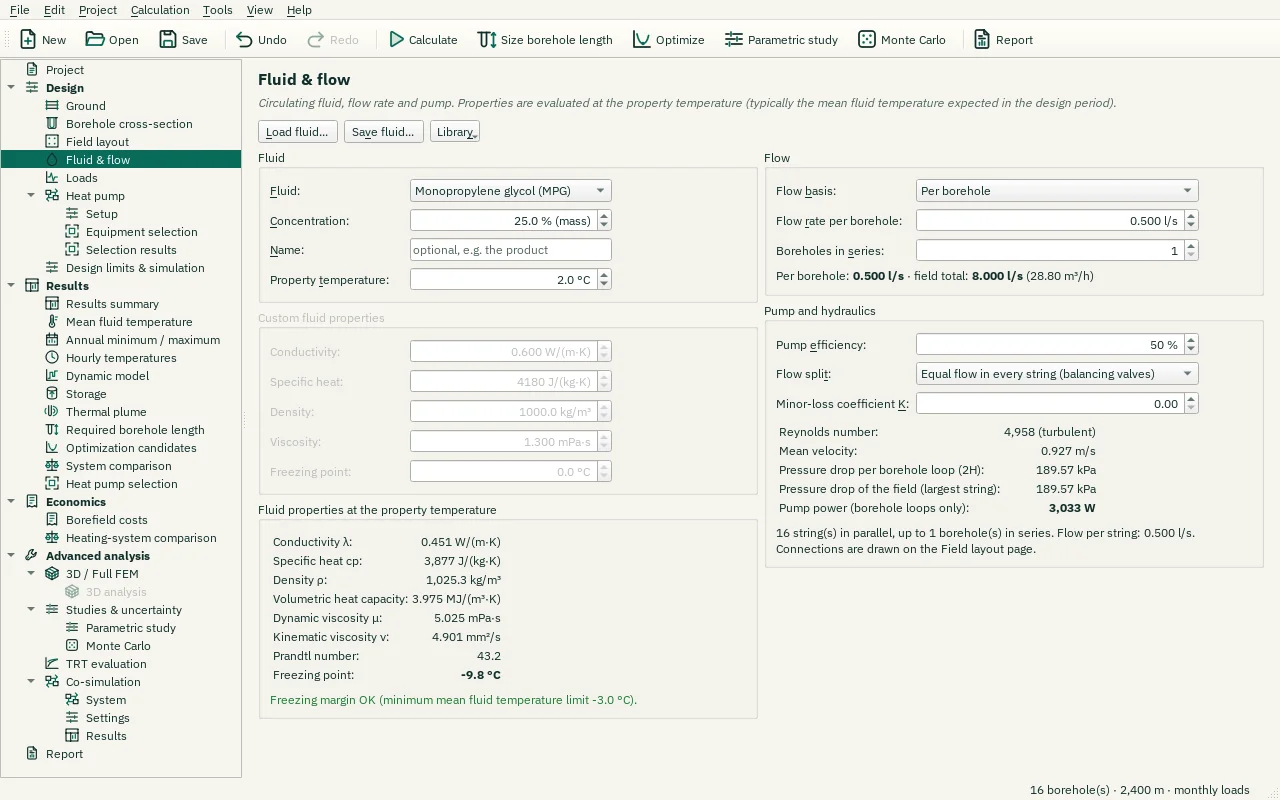
Choose the carrier fluid and concentration, property temperature, flow basis and connection arrangement. Total flow and per-borehole flow are different inputs. A series string shares flow and adds pressure loss. A temperature below the fluid freezing point is flagged; the model does not simulate phase change. Verify the pump operating point against the hydraulic network.
Step-by-step workflows · Menus and keyboard
| Control | Meaning / action | Unit | Range / choices | Example value |
|---|---|---|---|---|
| Load fluid… | Load a saved fluid (.btfluid) or the fluid of another project: the fluid type, its concentration, constant values or property table and the freezing point. Flow, pump and property temperature stay as they are. | |||
| Save fluid… | Save this fluid as a file (.btfluid) to use it again in other projects. | |||
| Library | Typical fluids and the fluids saved in your library folder (Documents\BoreTherm\Fluids). | |||
| Undo | Restore the fluid from before the load. | |||
| × | Hide this note (keep the loaded fluid). | |||
| Fluid: | Heat carrier fluid. Aqueous solutions (glycols, alcohols, salts, glycerol) protect against freezing but are more viscous than water. A table gives temperature-dependent properties (e.g. from a data sheet). The list shows a note on each fluid. | Water / / Glycols / Monoethylene glycol (MEG) / Monopropylene glycol (MPG) / / Alcohols / Ethanol / Methanol / / Salt solutions / Potassium formate / Potassium acetate / Potassium carbonate / Calcium chloride / Sodium chloride / / Glycerol / / Custom (constant properties) / Table (temperature-dependent) | ||
| Concentration: | Additive mass fraction. Typical: MEG 25 – 33 %, MPG 25 – 33 %, ethanol 20 – 25 %. Range of the Monopropylene glycol (MPG) correlation: 0 – 60 %. | % (mass) | 0 to 60 | 25 |
| Name: | Name of the fluid (e.g. the product and its concentration). Shown in the report and used as the name of a saved fluid file. | |||
| Property temperature: | Temperature at which the fluid properties are evaluated (one set of properties for the whole run). Choose the expected mean fluid temperature. | °C | -30 to 80 | 2 |
| Conductivity: | Thermal conductivity of the fluid. | W/(m·K) | 0.01 to 10 | 0.6 |
| Specific heat: | Specific heat capacity cp. | J/(kg·K) | 100 to 10000 | 4180 |
| Density: | Density ρ. | kg/m³ | 100 to 3000 | 1000 |
| Viscosity: | Dynamic viscosity μ. | mPa·s | 0.01 to 1000 | 1.3 |
| Freezing point: | Freezing point of the fluid. | °C | -80 to 20 | 0 |
| Flow basis: | Whether the flow rate below is per borehole or the total flow of the field. | Per borehole / Total for the field | ||
| Flow rate per borehole: | Volumetric flow rate. Aim for turbulent flow (Re > 2300) at the design temperature; typical 0.3 – 0.8 l/s per single-U borehole. | l/s | 0 to 1000 | 0.5 |
| Boreholes in series: | Series factor: strings of this many consecutive boreholes (by number). Flow per borehole = total flow / (N / series). Not used when connections drawn on the Field layout page define the strings. | 1 to 1000 | 1 | |
| Pump efficiency: | Overall pump efficiency (hydraulic × motor), used for the pump power. | % | 1 to 100 | 50 |
| Flow split: | How the flow divides between the strings. Equal flow: every string carries the same flow and the pump overcomes the largest string pressure drop. Equal pressure drop: the flow divides so that every string has the same pressure drop; shorter strings take more. | Equal flow in every string (balancing valves) / Equal pressure drop (reverse return, no valves) | ||
| Minor-loss coefficient K: | Minor-loss coefficient K of each string's connection to the headers (tees, valves, bends): adds K·ρv²/2 to the string's pressure drop, v = velocity in one borehole pipe. 0 = borehole loops only. | 0 to 1000 | 0 | |
| Add row | Add a row 5 K above the last one, with its values. | |||
| Remove rows | Remove the selected rows. | |||
| Paste | Paste from the clipboard (Ctrl+V), e.g. cells copied in Excel. Five columns T, λ, cp, ρ, μ replace the whole table; fewer are pasted at the current cell. | |||
| Copy | Copy the selected cells (or the whole table) to the clipboard (Ctrl+C). | |||
| Import CSV… | Read the table from a CSV file: columns T [°C], λ [W/(m·K)], cp [J/(kg·K)], ρ [kg/m³], μ [mPa·s], or named in a header line (a header "mu [Pa s]" reads the viscosity in Pa·s); "," or ";" separated. A line "freezing point; -15" sets the freezing point. | |||
| Start from | Replace the table by the properties of a typical fluid or of the constant values, from -20 to 40 °C in steps of 5 K (rows below its freezing point left out). | |||
| Freezing point: | Freezing point of the table's fluid: the calculation refuses fluid temperatures at or below it. | °C | -80 to 20 | -15 |
| Total flow rate: | Volumetric flow rate. Aim for turbulent flow (Re > 2300) at the design temperature; typical 0.3 – 0.8 l/s per single-U borehole. | l/s | 0 to 1000 | 2.921 |
| Property temperature: | Temperature at which the fluid properties are evaluated (one set of properties for the whole run). Choose the expected mean fluid temperature. | °F | -22 to 176 | 35.6 |
| Freezing point: | Freezing point of the fluid. | °F | -112 to 68 | 32 |
| Flow rate per borehole: | Volumetric flow rate. Aim for turbulent flow (Re > 2300) at the design temperature; typical 0.3 – 0.8 l/s per single-U borehole. | m³/h | 0 to 3600 | 1.8 |
| Freezing point: | Freezing point of the table's fluid: the calculation refuses fluid temperatures at or below it. | °F | -112 to 68 | 5 |
| Total flow rate: | Volumetric flow rate. Aim for turbulent flow (Re > 2300) at the design temperature; typical 0.3 – 0.8 l/s per single-U borehole. | m³/h | 0 to 3600 | 10.516 |