 BoreTherm
Hourly results
Inspect hourly ground load, mean fluid temperature and inlet/outlet temperatures. Inlet and outlet differ with mass flow and fluid heat capacity. Discontinuities follow the load schedule and reporting interval; increase time resolution when examining short events.
Step-by-step workflows · Menus and keyboard
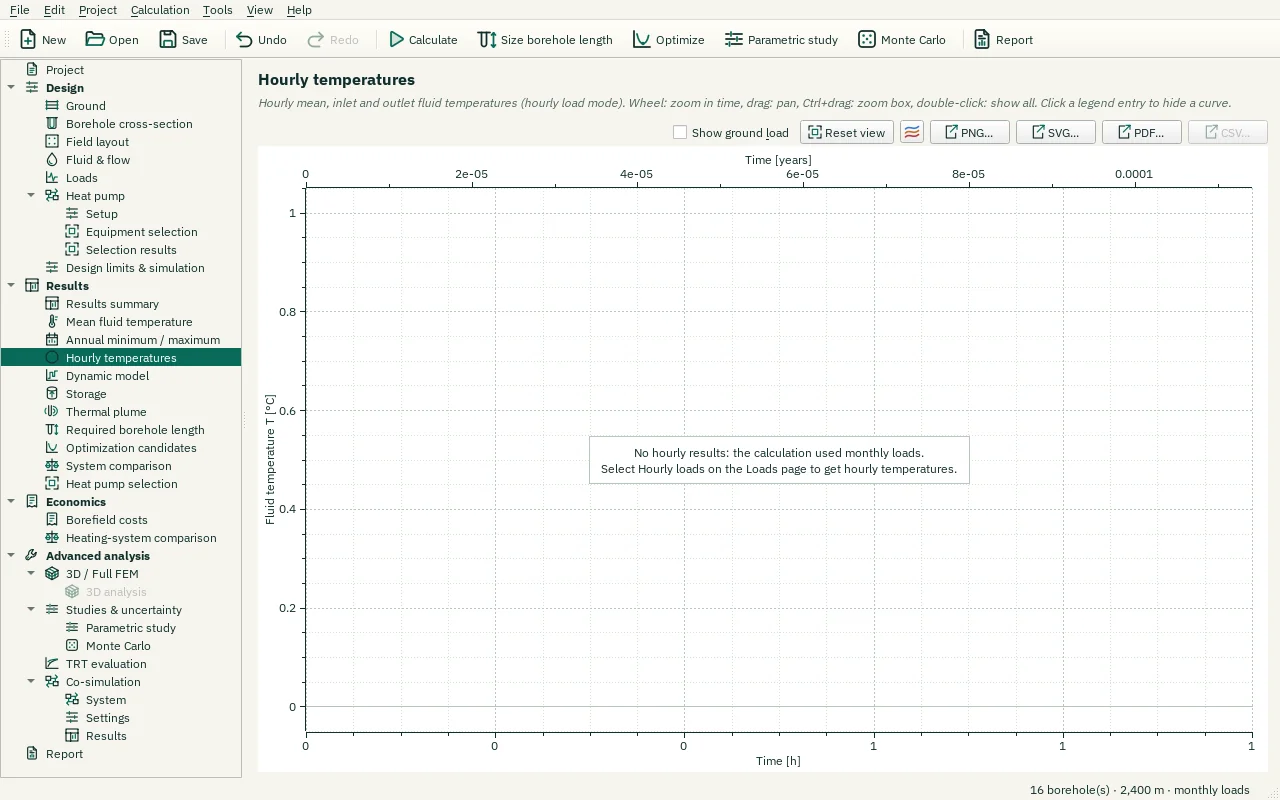
| Control | Meaning / action | Unit | Range / choices | Example value |
|---|---|---|---|---|
| Reset view | Show all data (also: double-click the plot). | |||
| Chart style button | Chart style: title, axis titles, legend, colours, line widths and markers, fonts, grid and background (also in the chart's context menu). | |||
| PNG… | Export the plot as a PNG image. | |||
| SVG… | Export the plot as a vector SVG image (for Word, Inkscape, …). | |||
| PDF… | Export the plot as a vector PDF. | |||
| CSV… | Export the plotted data as CSV. | |||
| Show ground load | Plot the hourly ground heat rate on the right axis. |