 BoreTherm
Load growth
Specify annual growth or an explicit year schedule and inspect its coverage. Each year's energy/peak treatment follows the selected growth settings. Partial or inconsistent schedules produce diagnostics.
Step-by-step workflows · Menus and keyboard
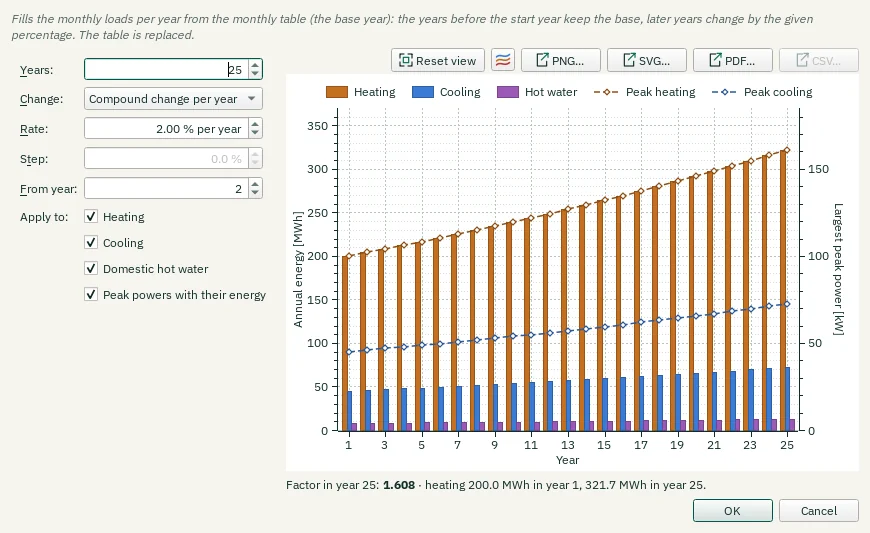
| Control | Meaning / action | Unit | Range / choices | Example value |
|---|---|---|---|---|
| Years: | Years in the table (normally the simulation period). | 1 to 100 | 25 | |
| Change: | Compound: factor (1 + p)ⁿ after n years of change. Linear: factor 1 + n·p. Step: one change from the start year on. | Compound change per year / Linear change per year / Step change | ||
| Rate: | Change per year; negative for a decline (the loads stop at zero). | % per year | -50 to 100 | 2 |
| Step: | Change of the loads from the start year on. | % | -100 to 500 | 0 |
| From year: | First year that differs from the base year. | 1 to 100 | 2 | |
| Apply to: | Enables or disables this option. | |||
| Cooling | Enables or disables this option. | |||
| Domestic hot water | Enables or disables this option. | |||
| Peak powers with their energy | Scale the heating and cooling peak powers like their energy (the peak durations stay). | |||
| Reset view | Show all data (also: double-click the plot). | |||
| Chart style button | Chart style: title, axis titles, legend, colours, line widths and markers, fonts, grid and background (also in the chart's context menu). | |||
| PNG… | Export the plot as a PNG image. | |||
| SVG… | Export the plot as a vector SVG image (for Word, Inkscape, …). | |||
| PDF… | Export the plot as a vector PDF. | |||
| CSV… | Export the plotted data as CSV. | |||
| OK | Accept changes and close. | |||
| Cancel | Close without accepting unapplied edits. |