 BoreTherm
Monte Carlo setup
Specify distributions, their parameters/truncation, correlations, sample count, random seed and sampling method. Invalid distributions or correlation matrices are rejected. Start runs the uncertainty study; inspect failed cases rather than silently dropping them.
Step-by-step workflows · Menus and keyboard
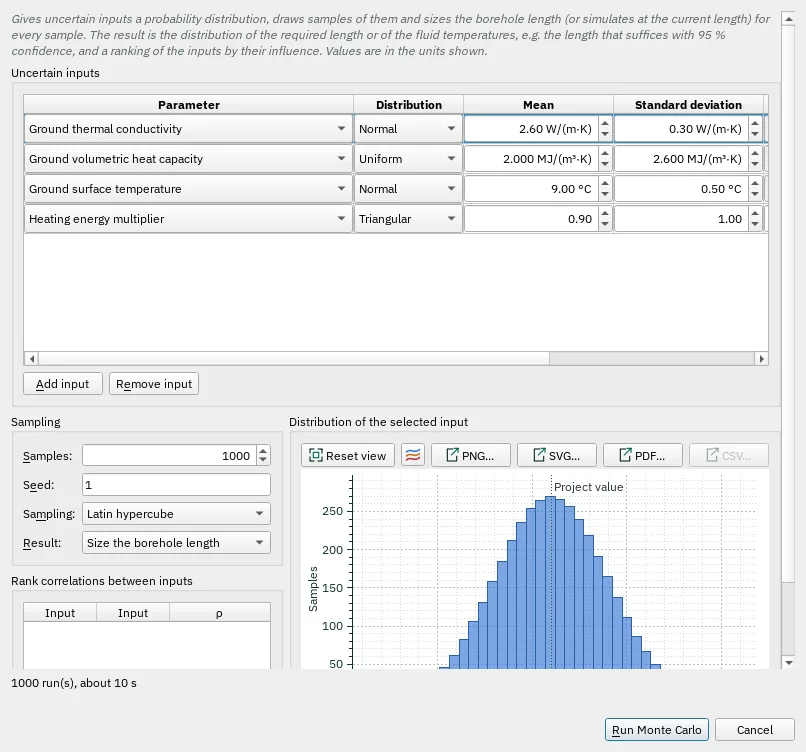
| Control | Meaning / action | Unit | Range / choices | Example value |
|---|---|---|---|---|
| Normal: mean and standard deviation. Log-normal: median and the standard deviation σ of ln x (positive values only). Uniform: minimum and maximum. Triangular: minimum, most likely value (mode) and maximum. | Normal: mean and standard deviation. Log-normal: median and the standard deviation σ of ln x (positive values only). Uniform: minimum and maximum. Triangular: minimum, most likely value (mode) and maximum. | Normal / Log-normal / Uniform / Triangular | ||
| Mean of the normal distribution. | Mean of the normal distribution. | W/(m·K) | 0.1 to 10 | 2.6 |
| Standard deviation (0 = the mean without scatter). | Standard deviation (0 = the mean without scatter). | W/(m·K) | 0 to 9.9 | 0.3 |
| Optional lower bound: samples are drawn from the distribution truncated at this value. | Optional lower bound: samples are drawn from the distribution truncated at this value. | |||
| Optional upper bound: samples are drawn from the distribution truncated at this value. | Optional upper bound: samples are drawn from the distribution truncated at this value. | |||
| Smallest value. | Smallest value. | MJ/(m³·K) | 0.5 to 5 | 2 |
| Largest value. | Largest value. | MJ/(m³·K) | 0.5 to 5 | 2.6 |
| Mean of the normal distribution. | Mean of the normal distribution. | °C | -20 to 40 | 9 |
| Standard deviation (0 = the mean without scatter). | Standard deviation (0 = the mean without scatter). | °C | 0 to 60 | 0.5 |
| Smallest value. | Smallest value. | 0 to 10 | 0.9 | |
| Most likely value (mode). | Most likely value (mode). | 0 to 10 | 1 | |
| Largest value. | Largest value. | 0 to 10 | 1.15 | |
| Add input | Add an uncertain parameter and configure its distribution. | |||
| Remove input | Remove the selected uncertainty input. | |||
| Samples: | Number of samples (runs). 1,000 samples give stable percentiles up to P95. | 2 to 100000 | 1000 | |
| Seed: | Seed of the random numbers: the same seed and setup give the same samples and results. | |||
| Sampling: | Latin hypercube: one sample in each of N equally likely strata per input; converges faster than plain random sampling. | Latin hypercube / Random | ||
| Result: | Select one of the listed alternatives. | Size the borehole length / Simulate at the current length | ||
| Add correlation | Add a pairwise correlation; the assembled matrix must be valid. | |||
| Remove correlation | Remove the selected pairwise correlation. | |||
| Reset view | Show all data (also: double-click the plot). | |||
| Chart style button | Chart style: title, axis titles, legend, colours, line widths and markers, fonts, grid and background (also in the chart's context menu). | |||
| PNG… | Export the plot as a PNG image. | |||
| SVG… | Export the plot as a vector SVG image (for Word, Inkscape, …). | |||
| PDF… | Export the plot as a vector PDF. | |||
| CSV… | Export the plotted data as CSV. | |||
| Run Monte Carlo | Validate the uncertainty setup and start the configured samples. | |||
| Cancel | Close without accepting unapplied edits. |