 BoreTherm
Storage
Results per operating year of the dynamic borehole model: the heat charged into the ground (E_in, the positive ground load summed over the steps with flow) and discharged from it (E_out, the negative ground load summed over the steps with flow), the recovery E_out / E_in of the year and cumulative from year 1, the charging, discharging and pump-off hours, the flow reversals and the inlet / outlet temperature ranges with the pump running. All discharged heat counts: there is no useful-heat threshold or return-temperature cut-off, so compare the outlet temperatures with what the plant can use. Ring or per-borehole ground coupling resolves the spatial redistribution (per-ring results: Dynamic model › Rings); uniform coupling is a simpler model. Differences in the discharged energy against an independent finite-element code are documented.
Step-by-step workflows · Menus and keyboard
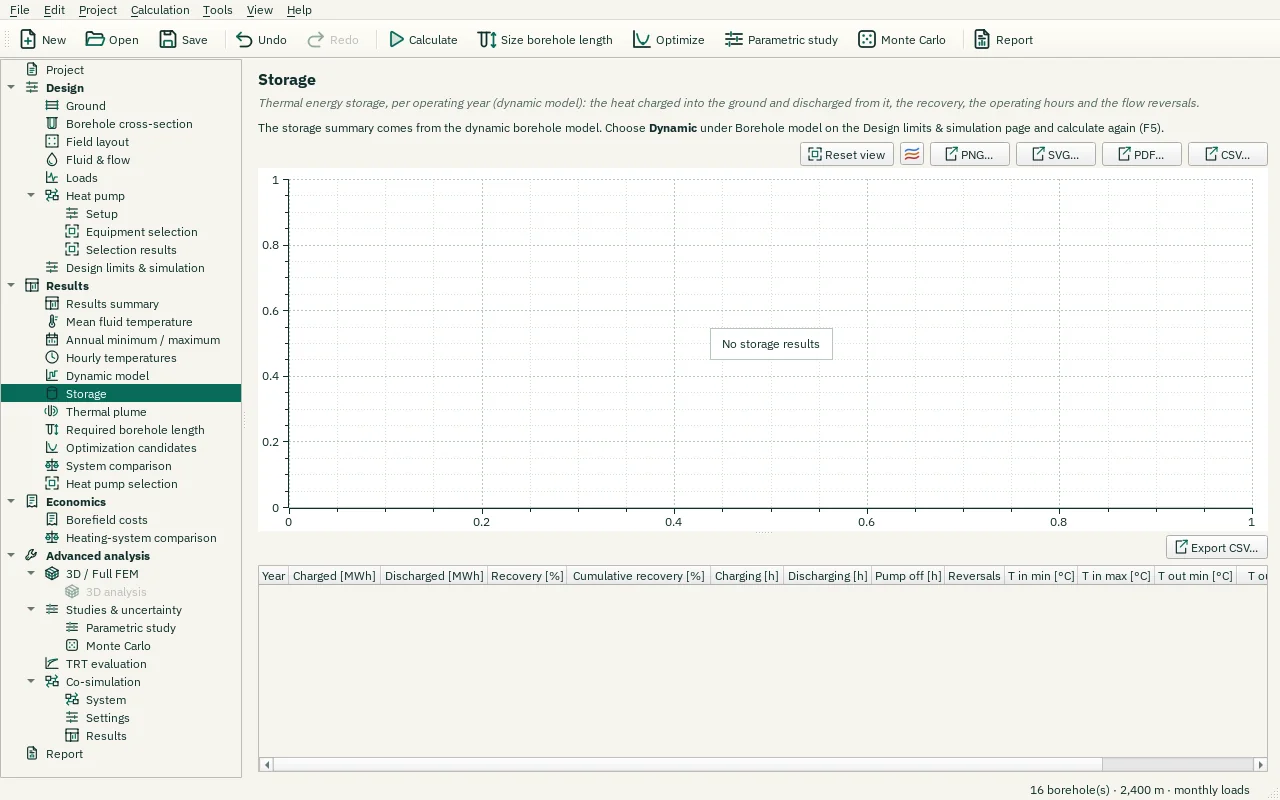
| Control | Meaning / action | Unit | Range / choices | Example value |
|---|---|---|---|---|
| Export CSV… | Write the displayed numerical table to a CSV file using the selected CSV format. | |||
| Reset view | Show all data (also: double-click the plot). | |||
| Chart style button | Chart style: title, axis titles, legend, colours, line widths and markers, fonts, grid and background (also in the chart's context menu). | |||
| PNG… | Export the plot as a PNG image. | |||
| SVG… | Export the plot as a vector SVG image (for Word, Inkscape, …). | |||
| PDF… | Export the plot as a vector PDF. | |||
| CSV… | Export the plotted data as CSV. |