 BoreTherm
Parametric study
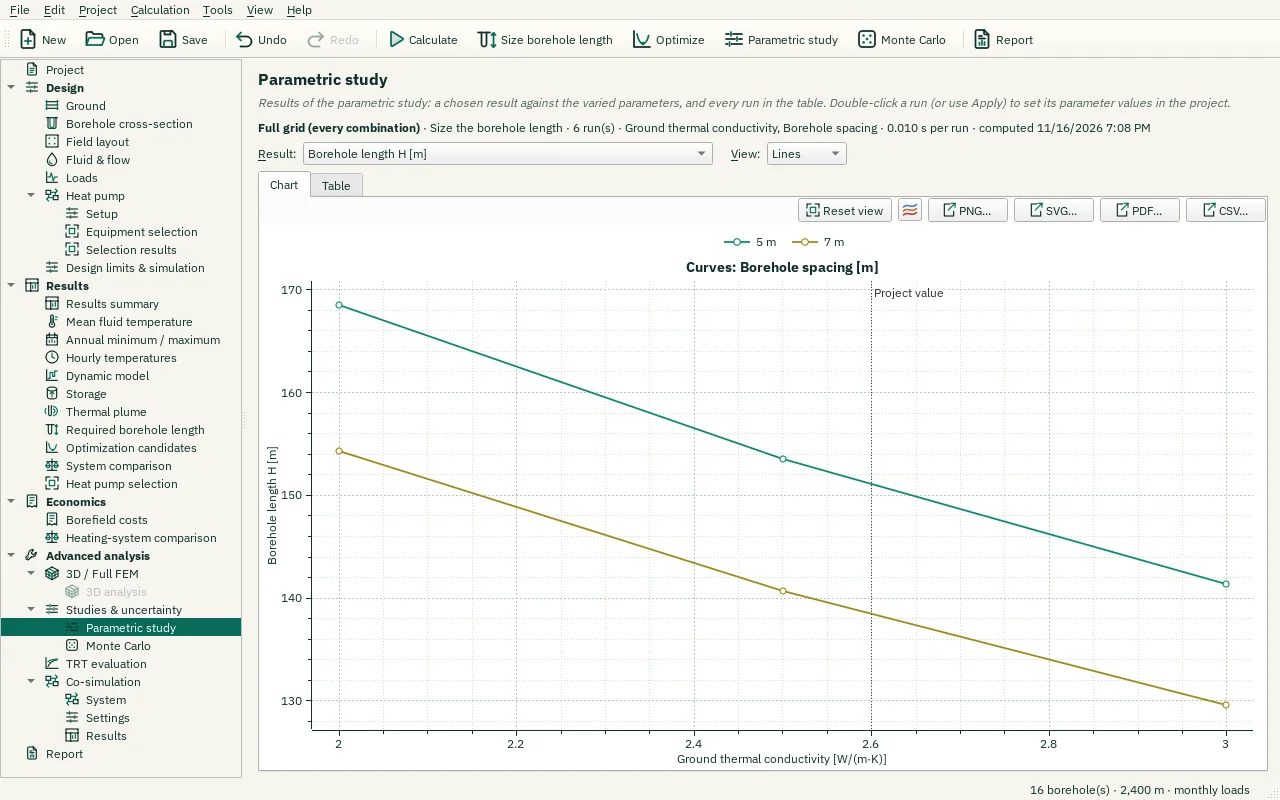
Compare cases for one-at-a-time, grid or other selected study sampling. Sizing mode reports required depth; fixed-depth mode reports temperatures. Failed cases remain visible. Input axes and their units come from the selected parameter IDs.
Step-by-step workflows · Menus and keyboard
| Control | Meaning / action | Unit | Range / choices | Example value |
|---|---|---|---|---|
| Result: | The result shown in the chart. | Borehole length H [m] / Total borehole length [m] / Minimum mean fluid temperature Tf,min [°C] / Maximum mean fluid temperature Tf,max [°C] / Effective borehole thermal resistance Rb* [m·K/W] / Borehole thermal resistance Rb [m·K/W] / Undisturbed ground temperature Tm [°C] / Pump power [W] / Effective thermal conductivity λeff [W/(m·K)] / Ground-source heat pump levelised cost of heat [EUR/kWh] / Ground-source heat pump seasonal performance factor (SPF) | ||
| View: | Two parameters: one line per value of the second parameter, or a heat map of the result. | Lines / Heat map | ||
| Three parameters: the value of the third parameter shown. | Three parameters: the value of the third parameter shown. | |||
| Apply run to project | Set the parameter values of the selected run in the project (one at a time: the varied parameter only). | |||
| Export CSV… | Write the displayed numerical table to a CSV file using the selected CSV format. | |||
| Reset view | Show all data (also: double-click the plot). | |||
| Chart style button | Chart style: title, axis titles, legend, colours, line widths and markers, fonts, grid and background (also in the chart's context menu). | |||
| PNG… | Export the plot as a PNG image. | |||
| SVG… | Export the plot as a vector SVG image (for Word, Inkscape, …). | |||
| PDF… | Export the plot as a vector PDF. | |||
| CSV… | Export the plotted data as CSV. |