 BoreTherm
Results summary
Review minimum and maximum mean fluid temperature, design limits, borehole resistances, pressure losses and warnings. A successful calculation is not necessarily a feasible design. Click the result charts or field views to open their full pages. Export CSV writes numerical results; the chosen CSV format determines delimiter and decimal separator.
Step-by-step workflows · Menus and keyboard
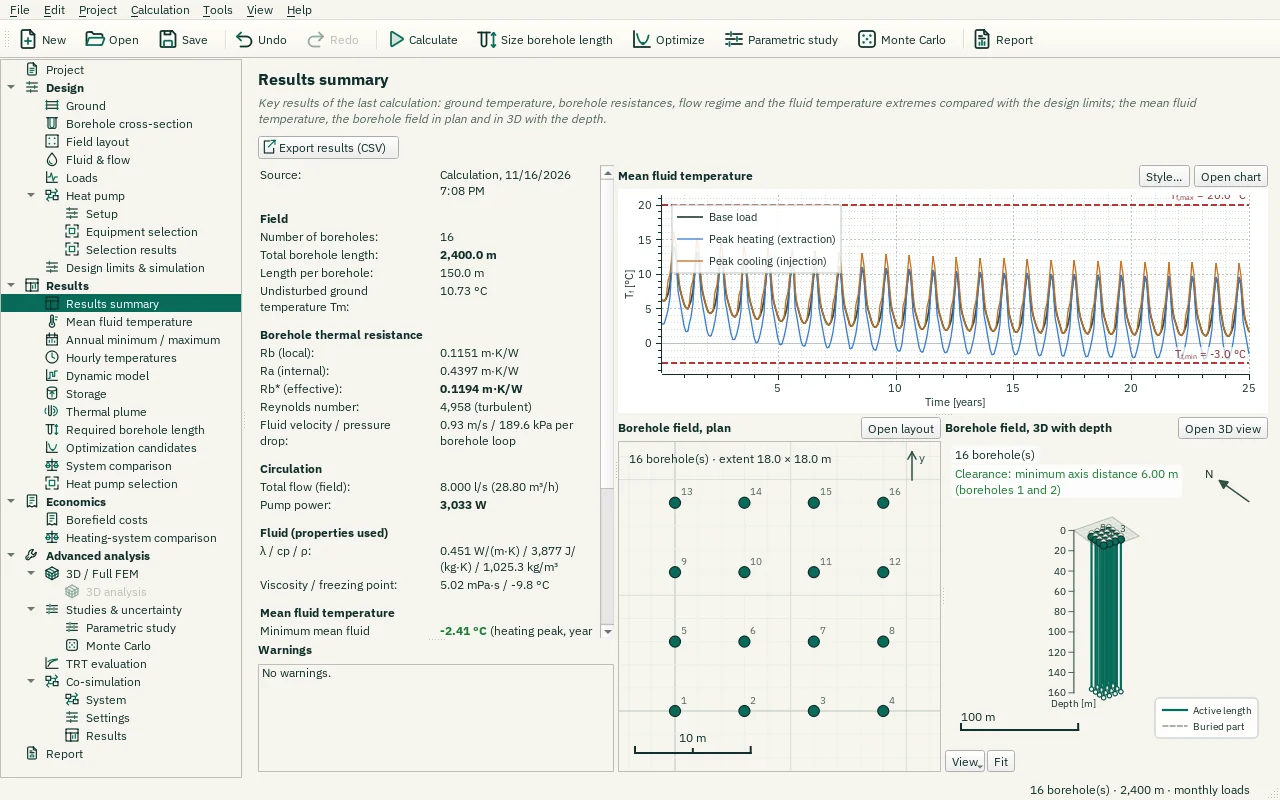
| Control | Meaning / action | Unit | Range / choices | Example value |
|---|---|---|---|---|
| Export results (CSV) | Export results (CSV) | |||
| Open 3D view | Open the Field layout page with the 3D view. | |||
| View | View direction, depth scale, perspective, ground layers, borehole sections, buried part and site plan (the same settings as on the Field layout page). Drag to rotate, wheel to zoom. | |||
| Depth scale: | Vertical exaggeration of the depth (1 = true scale). | × | 0.1 to 20 | 1 |
| Fit | Fit the field into the view, keeping the direction (also: double-click). | |||
| Open layout | Open the Field layout page with the plan (2D) view. | |||
| Open chart | Open the Mean fluid temperature page (chart and table). | |||
| Reset view | Show all data (also: double-click the plot). | |||
| Chart style button | Chart style: title, axis titles, legend, colours, line widths and markers, fonts, grid and background (also in the chart's context menu). | |||
| PNG… | Export the plot as a PNG image. | |||
| SVG… | Export the plot as a vector SVG image (for Word, Inkscape, …). | |||
| PDF… | Export the plot as a vector PDF. | |||
| CSV… | Export the plotted data as CSV. | |||
| Style… | Chart style: colours, line widths, texts, fonts, legend and grid (also: right-click the chart). Shared with the Mean fluid temperature page and the report. |