 BoreTherm
Mean fluid temperature
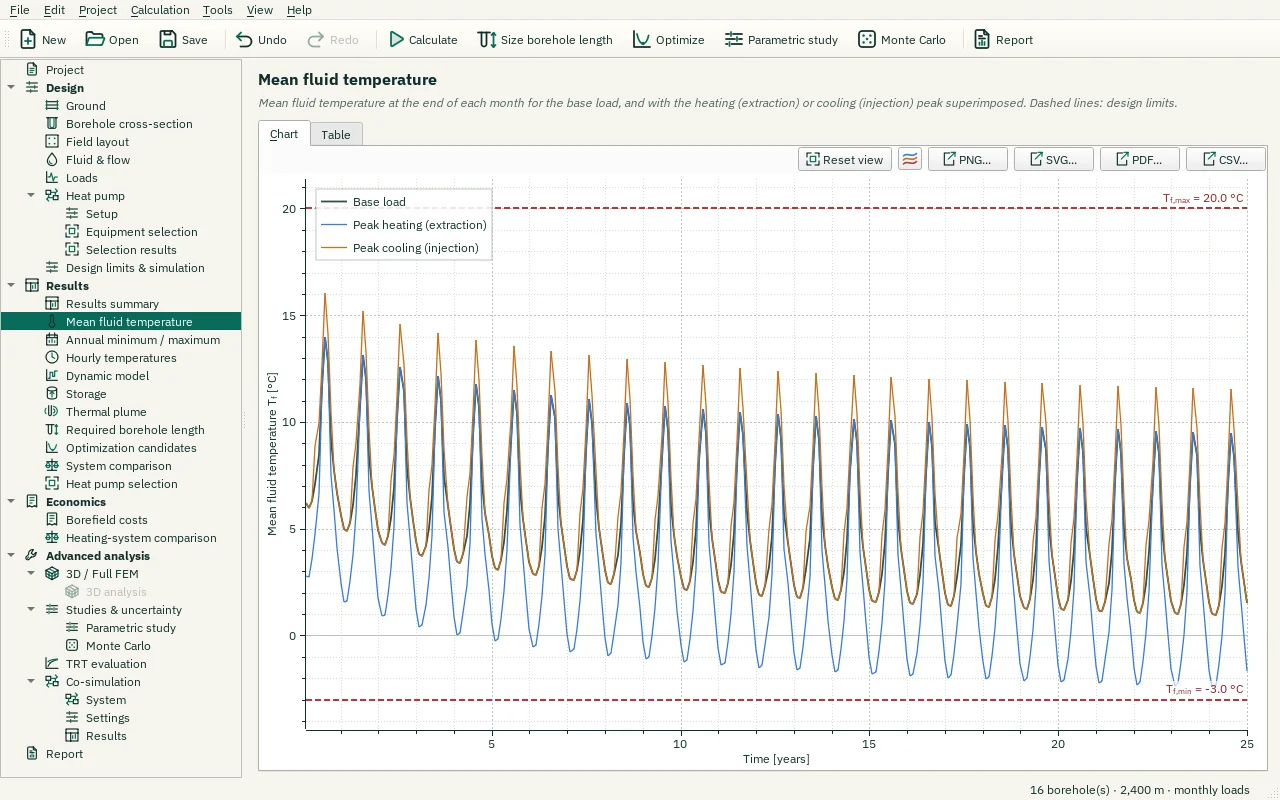
Compare base and peak temperatures over the full design period. Peak pulses are evaluated in addition to monthly base loads. Limit lines indicate design constraints. Use the chart context menu to copy, export or change the chart style.
Step-by-step workflows · Menus and keyboard
| Control | Meaning / action | Unit | Range / choices | Example value |
|---|---|---|---|---|
| Export CSV… | Write the displayed numerical table to a CSV file using the selected CSV format. | |||
| Reset view | Show all data (also: double-click the plot). | |||
| Chart style button | Chart style: title, axis titles, legend, colours, line widths and markers, fonts, grid and background (also in the chart's context menu). | |||
| PNG… | Export the plot as a PNG image. | |||
| SVG… | Export the plot as a vector SVG image (for Word, Inkscape, …). | |||
| PDF… | Export the plot as a vector PDF. | |||
| CSV… | Export the plotted data as CSV. |