 BoreTherm
TRT comparison
Compare fits and residuals across selected methods and windows. Check consistency with the test setup and reference values before applying a result. Export the TRT report with fitting assumptions and retained data.
Step-by-step workflows · Menus and keyboard
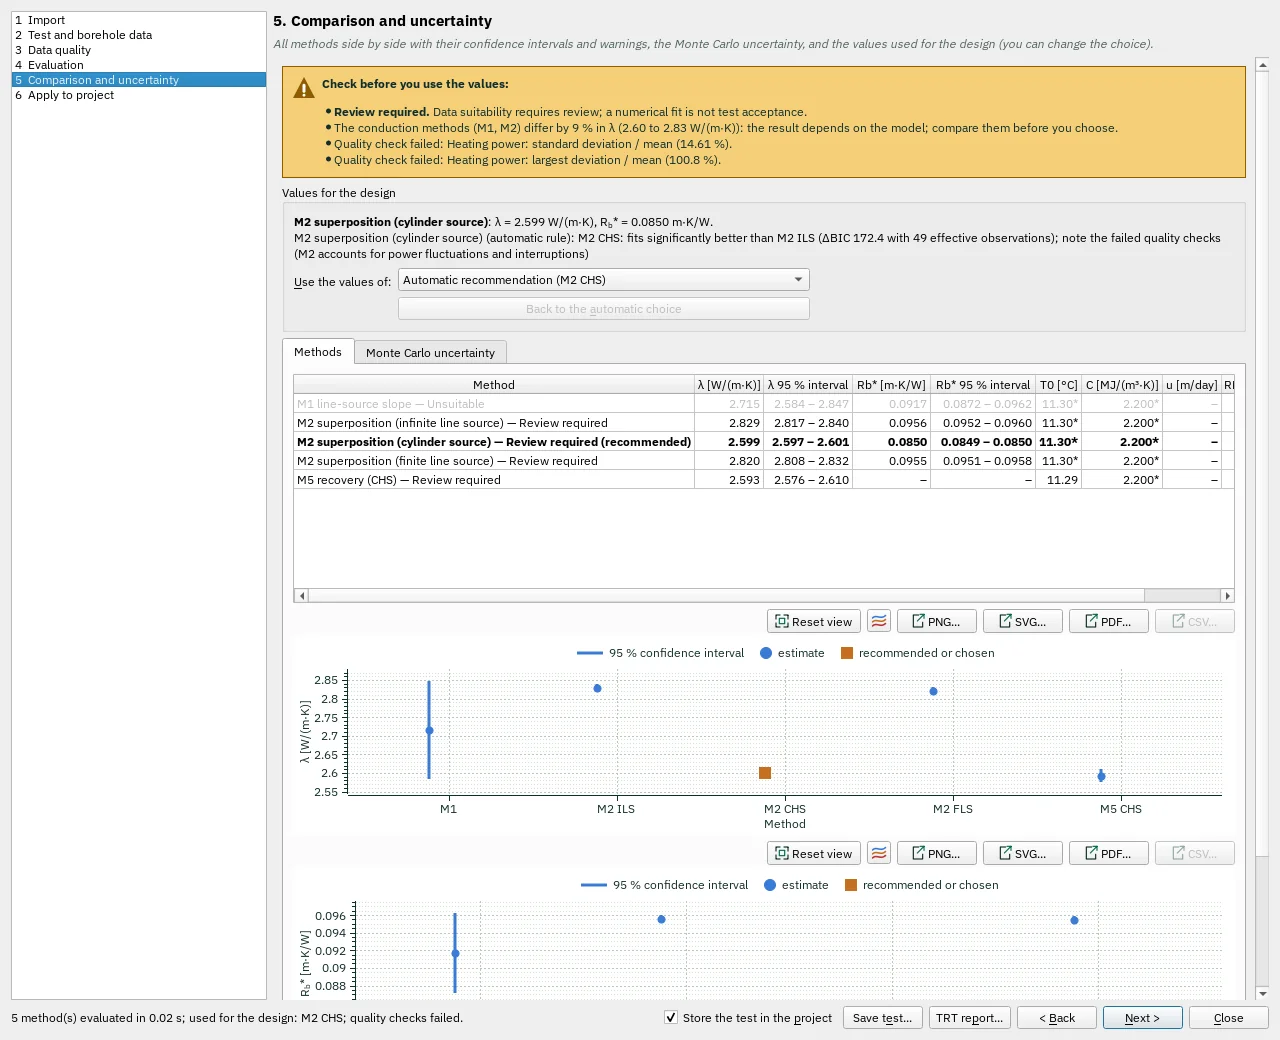
| Control | Meaning / action | Unit | Range / choices | Example value |
|---|---|---|---|---|
| Use the values of: | The recommended applicable fit is selected automatically. You can choose another applicable fit; unavailable methods are greyed out and explain why in their tooltips. | Automatic recommendation (M2 CHS) / M1 line-source slope — not applicable / M2 superposition (infinite line source) — Review required / M2 superposition (cylinder source) — Review required (recommended) / M2 superposition (finite line source) — Review required / M3 moving line source (groundwater) — not applicable / M5 recovery (CHS) — Review required | ||
| Back to the automatic choice | Discard your choice: the automatic rule selects the fit again | |||
| Samples: | Realisations of the input errors (0 = off; 200 to 1,000 give stable P5/P95) | 0 to 100000 | 200 | |
| Seed: | Seed of the random numbers: the same seed gives the same result | |||
| Power: | Heating power meter (measured power) | % | 0 to 50 | 2 |
| Flow: | Flow meter (power from flow and ΔT) | % | 0 to 50 | 1 |
| Temperature sensors: | Offset of each temperature sensor | K | 0 to 5 | 0.05 |
| Length H: | Active borehole length | m | 0 to 50 | 0.5 |
| Borehole radius: | Borehole radius | mm | 0 to 50 | 2 |
| Heat capacity C: | Volumetric heat capacity of the ground | % | 0 to 100 | 10 |
| T0: | Undisturbed ground temperature | K | 0 to 10 | 0.2 |
| Run Monte Carlo | Validate the uncertainty setup and start the configured samples. | |||
| Histograms of: | Select one of the listed alternatives. | |||
| Reset view | Show all data (also: double-click the plot). | |||
| Chart style button | Chart style: title, axis titles, legend, colours, line widths and markers, fonts, grid and background (also in the chart's context menu). | |||
| PNG… | Export the plot as a PNG image. | |||
| SVG… | Export the plot as a vector SVG image (for Word, Inkscape, …). | |||
| PDF… | Export the plot as a vector PDF. | |||
| CSV… | Export the plotted data as CSV. | |||
| Use the values of: | The recommended applicable fit is selected automatically. You can choose another applicable fit; unavailable methods are greyed out and explain why in their tooltips. | Automatic recommendation (M2 ILS) / M1 line-source slope — not applicable / M2 superposition (infinite line source) — Review required (recommended) / M2 superposition (cylinder source) — Review required / M2 superposition (finite line source) — Review required / M3 moving line source (groundwater) — not applicable / M5 recovery — not applicable |