 BoreTherm
TRT quality and screening
Review test duration, power/flow stability, interruptions, spikes, gaps, energy balance and fitting-window suitability. Raw heat history is retained when temperature observations are excluded. A successful numerical fit does not resolve a failed quality criterion.
Step-by-step workflows · Menus and keyboard
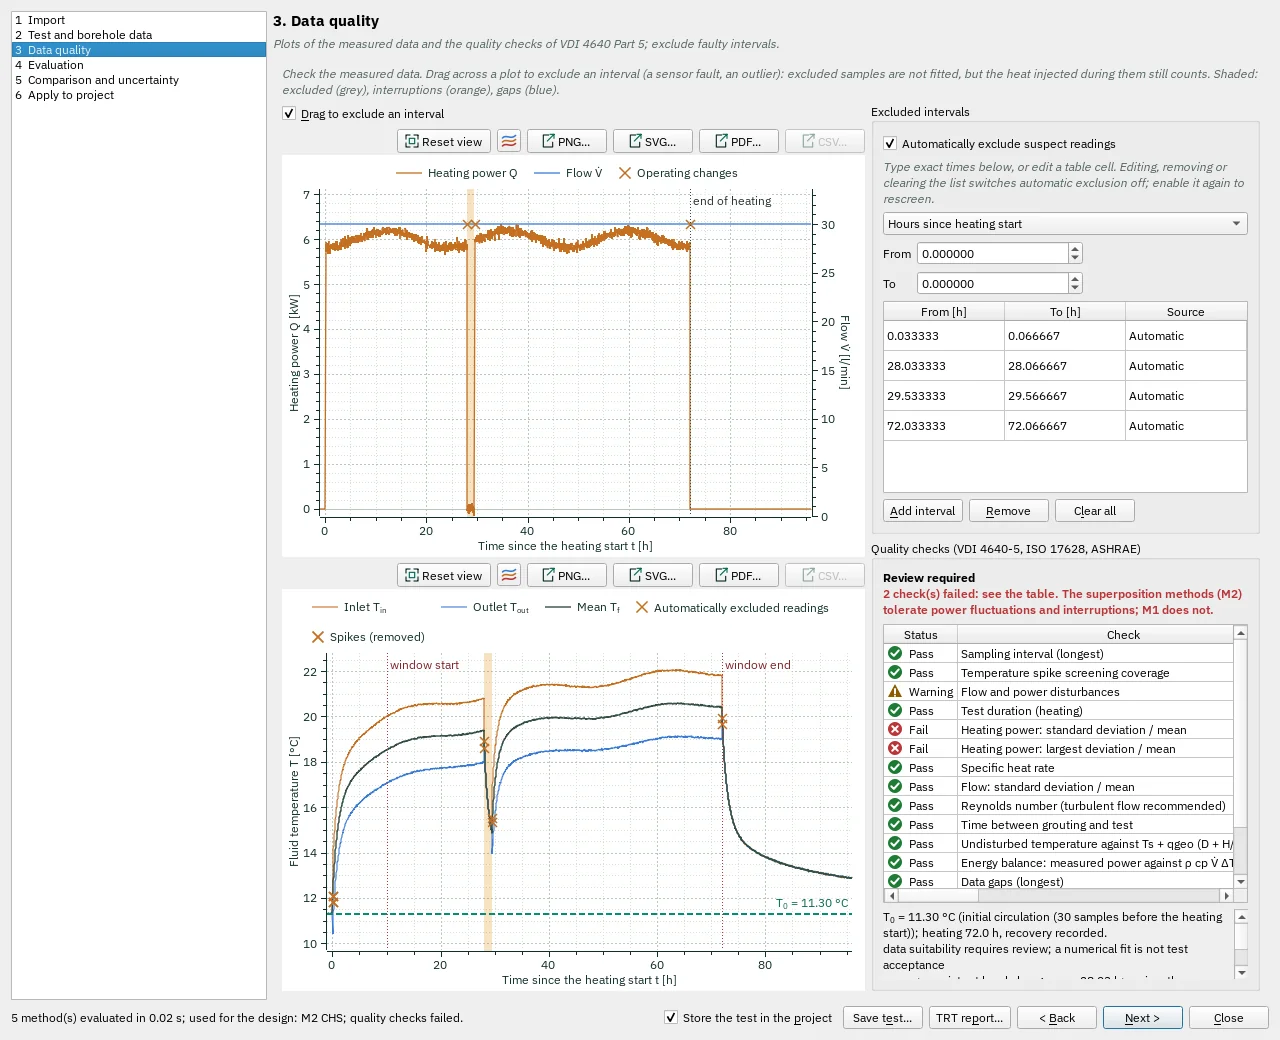
| Control | Meaning / action | Unit | Range / choices | Example value |
|---|---|---|---|---|
| Drag to exclude an interval | On: a drag across a plot excludes that interval. Off: a drag moves the view. | |||
| Reset view | Show all data (also: double-click the plot). | |||
| Chart style button | Chart style: title, axis titles, legend, colours, line widths and markers, fonts, grid and background (also in the chart's context menu). | |||
| PNG… | Export the plot as a PNG image. | |||
| SVG… | Export the plot as a vector SVG image (for Word, Inkscape, …). | |||
| PDF… | Export the plot as a vector PDF. | |||
| CSV… | Export the plotted data as CSV. | |||
| Automatically exclude suspect readings | Exclude detected temperature outliers and flow/power disturbances from fitting. Raw readings and measured heat history are preserved. | |||
| Interval time unit | Unit used for the start and end of excluded observation intervals. | Hours since heating start / Seconds in the data | ||
| From | Enter a numerical value in the shown units. | -1e+12 to 1e+12 | 0 | |
| To | Enter a numerical value in the shown units. | -1e+12 to 1e+12 | 0 | |
| Add interval | Add an observation-exclusion interval with start/end times. | |||
| Remove | Remove the selected evaluation item or interval from this table. | |||
| Clear all | Remove the manually selected exclusion intervals. |