 BoreTherm
Full FEM results
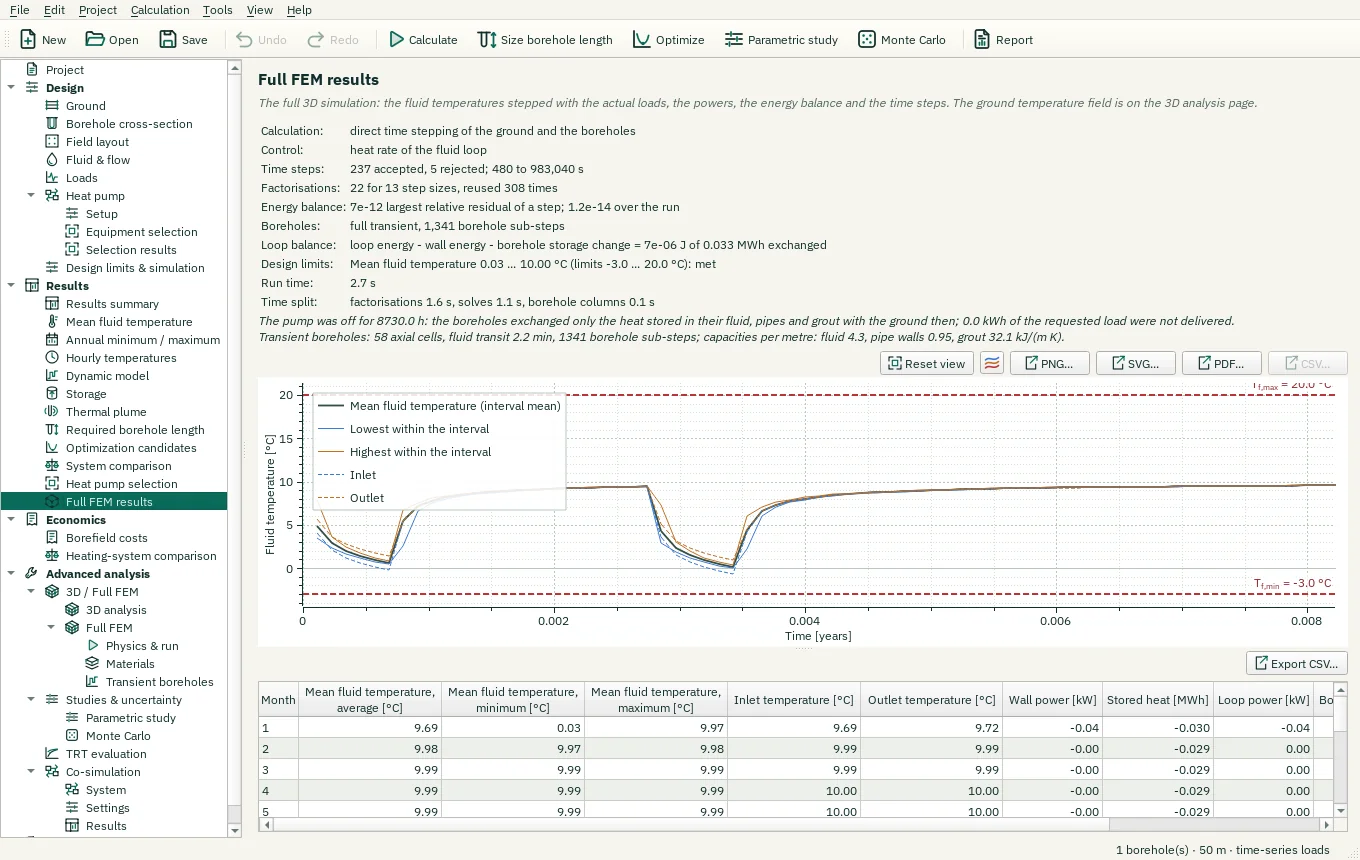
Full FEM results: the calculation, loop control, time steps, coupling, energy, loop and water balances, the design-limit check against the 2D design and the run time; the fluid temperatures per output interval and per month; the hydraulic head and Darcy velocity in the 3D view (coupled TH). Rerun with a step tolerance of 0.003 K for hourly results and after a load or pump stop with transient boreholes.
What this page shows
This page appears under Results when the Project page has 3D analysis: Full FEM, after Run full 3D simulation on Physics & run. The ground temperature field, the plume maps and the 2D / 3D comparison are on the 3D analysis page.
- Summary: the calculation (direct time stepping of the ground and the boreholes, or of pressure and temperature for the coupled ground), the loop control, the time steps (accepted / rejected, smallest to largest), factorisations, the coupling iterations and the water balance (coupled TH), the energy balance and, with transient boreholes, the loop balance (loop energy − wall energy − change of the borehole storage), the heat through the faces of the block, the design limits line (3D extremes against the limits; it says when the 3D model changes the feasibility of the 2D design), the run time and its split. The notes below list assumed inputs and run notes.
- Chart: the mean fluid temperature per output interval (the load interval: an hour for hourly loads, a month for monthly loads), the lowest and highest value within each interval at the solver's steps, inlet and outlet. The time axis is in years: zoom with Ctrl+drag (a box) or the mouse wheel; double-click shows all.
- Table: per month the means, the extremes, inlet and outlet, wall power, heat stored in the ground, loop power and the heat in the boreholes (transient boreholes); Export CSV….
- Show in the 3D view (coupled TH): the hydraulic head or the Darcy velocity over time in the 3D view of the 3D analysis page.
Short-time results: the default step tolerance (0.01 K) is right for monthly design runs. For hourly results and the first interval after a load stop or a pump stop with transient boreholes, rerun with a tighter tolerance such as 0.003 K (Physics & run › Time stepping › Tolerance); the Lowest within the interval curve right after a stop is the most sensitive value (tutorial 12: 2.58 °C at 0.01 K, 1.23 °C at 0.003 K).
Guided examples: 12 Full FEM with transient boreholes · 13 Full FEM with groundwater flow (TH).
Step-by-step workflows · Menus and keyboard
| Control | Meaning / action | Unit | Range / choices | Example value |
|---|---|---|---|---|
| Hydraulic head | The hydraulic head of the run over time in the 3D view of the 3D analysis page. | |||
| Darcy velocity | The magnitude of the Darcy velocity of the run over time in the 3D view of the 3D analysis page. | |||
| Export CSV… | Write the displayed numerical table to a CSV file using the selected CSV format. | |||
| Reset view | Show all data (also: double-click the plot). | |||
| Chart style button | Chart style: title, axis titles, legend, colours, line widths and markers, fonts, grid and background (also in the chart's context menu). | |||
| PNG… | Export the plot as a PNG image. | |||
| SVG… | Export the plot as a vector SVG image (for Word, Inkscape, …). | |||
| PDF… | Export the plot as a vector PDF. | |||
| CSV… | Export the plotted data as CSV. |